
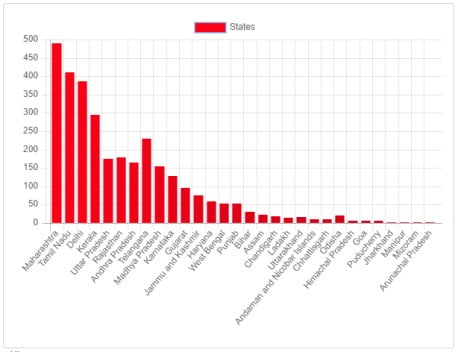
In last blog COVID India Real Data In Lightning Community , I have given detail about showing live data of COVID19 patients. In this post, I will show that data in chart for all states.
I have used chart.js for creating bar chart. For creating chart using this library we need below four information.
- Numeric data in array which we need to show
- Labels in string array
- options or setting for chart
- type of chart. Chart can be bar, line etc. You can check type from chart.js site.
 var lineChart = new Chart(ctx, {
            type: 'bar', //point 4
            data: {
                labels: this.stateNames, //point 2
                datasets: [{
                    label: 'States',
                    backgroundColor: this.colors,
                    data: this.values, //point 1
                    borderColor: 'rgba(121, 159, 222, 1)'
                }]
             },
             options{ {
                legend: {
                    position: 'top',
                    padding: 10,
                } //point 3
          }});
import chartjs from '@salesforce/resourceUrl/chart';
we are ready with chart but before running we need data. We need to get data from Apex, i have shared that detail in my last blog. We need to call method getNationalData of class COVIDDataService to get data. We need to create array of all data.
for (var key in this.nationaldata) {
      if(result.statewise[key].state!='Total' && result.statewise[key].confirmed>0)
      {
          this.stateNames.push(result.statewise[key].state);  // Array of State Name
          this.values.push(result.statewise[key].confirmed); // Array of Confirmed Patient
          this.colors.push('rgba('+(255-(parseInt(key)*2))+', 0, 22, 1)'); // Array of BG Color
      }
}
Complete Code:
Apex Code
Refer blog COVID India Real Data In Lightning Community to get apex COVIDDataService code. Add complete Apex code from that blog.
Sample Page:
Reference: https://www.chartjs.org/samples/latest/
Portal Link : https://vagminecodexone-developer-edition.ap15.force.com/covidindia/s/
1 Comment
Pingback: HeatMap Chart In LWC | SalesforceCodex